
Page 81 - Eshre 2018
P. 81
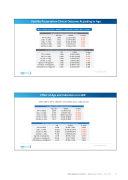
  Fertility Preservation Clinical Outcome According to Age.
 OR for SV≥90% for EFP vs. ONCO‐FP= 1.484 (CI95%= 0.876‐2.252); P=0.202
 LR Model‐ SV≥90%. Categorized by age
   Adj. OR
CI95%
P value
EFP vs ONCO
1.968
(1.121‐3.445)
0.018
≤35 y. vs ≥36y.
1.922
(1.274‐2.900)
0.025
≤30 y. vs >40y.
4.116
(1.566‐10.820)
0.004
31‐35y. vs >40y.
2.746
(1.474‐5.115)
0.001
36‐40y. vs >40y.
1.658
(1.259‐2.778)
0.045
     LR‐ SV≥90%. Categorized by Age and Type of Stimulation
   OR
CI95%
P value
EFP vs ONCO
1.396
(0.563‐3.460)
0.472
≤30 y. vs >40y.
3.942
(1.423‐10.918)
0.008
31‐35y. vs >40y.
2.603
(1.368‐4.953)
0.004
36‐40y. vs >40y.
1.696
(1.099‐2.906)
0.045
Agonist vs Antagonist
1.506
(0.582‐3.895)
0.398
Letrozole vs Antagonist
2.546
(0.840‐7.718)
0.099
Clomiphene vs Antagonist
1.455
(0.508‐4.169)
0.485
    Page 75 of 135
IVI unpublished data
             Effect of Age and Indication on CLBR
OR for CLBR for EFP vs. ONCO‐FP= 1.275 (CI95%= 0.711‐2.284); P=0.414
 LR Model‐ CLBR. Categorized by age
   Adj. OR
CI95%
P value
EFP vs ONCO
2.204
(1.162‐4.183)
0.016
≤35 y. vs ≥36y.
3.106
(2.039‐4.733)
<0.0001
≤30 y. vs >40y.
36.477
(9.847‐135.132)
<0.0001
31‐35y. vs >40y.
16.514
(5.581‐48.863)
<0.0001
36‐40y. vs >40y.
7.411
(2.640‐20.804)
<0.0001
    LR‐ CLBR Categorized by Age and Type of Stimulation
   OR
CI95%
P value
EFP vs ONCO
2.648
(0.949‐7.390)
0.063
≤30 y. vs >40y.
37.261
(8.790‐157.941)
<0.0001
31‐35y. vs >40y.
19.010
(5.564‐64.957)
<0.0001
36‐40y. vs >40y.
9.252
(2.838‐30.159)
<0.0001
Agonist vs Antagonist
1.109
(0.576‐2.134)
0.757
Letrozole vs Antagonist
0.524
(0.277‐1.001
0.051
Clomiphene vs Antagonist
1.120
(0.383‐3.273)
0.836
    IVI unpublished data
             PRECONGRESS COURSE 16 I BARCELONA, SPAIN – 1 JULY 2018 81
