
Page 68 - PRECONGRESS COURSE 06
P. 68
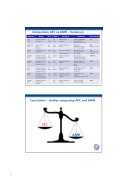
Tsakos 2014
Oehinger 2013
Andersen 2011
Arce 2013
Nelson 2015
Ganidou 2014
Comparison AFC vs AMH – Summary
Author
Mutlu 2013
Himabindu 2013
Study
Prospective cohort 102 women
Cross‐sectional study
56 women
Prospective cohort 105 women
Prospective cohort 694 women 35‐42yr (secondary of RCT)
prospective cohort 442 women (Secondary of RCT)
Prospective cohort 749 women AFC>10 (Secondary of RCT)
Prospective cohorts 1207 women AFC>10 or FSH<12 (Secondary of RCT)
Prospective cohort 100 women,
FSH <12
AFC
2‐ 10mm
2‐6 mm
2‐5mm
2‐ 10mm
2‐ 10mm
2‐ 10mm
2‐ 10mm
?
AMH
DSL Gen I
DSL Gen?
DSL Gen?
BC gen II
DSL Gen?
BC Gen II
BC gen I & gen II
DSL Gen II
Analyses
Multiple logistic regression
Multiple regression analysis
Spearman correlation Stepwise regression
Stepwise regression analyses
Stepwise regression analyses
Multiple regression analyses
Spearman correlation Stepwise regression analyses
Multiple regression analyses
Outcome
Model Age/AMH/AFC OR AMH 0,89 NS
OR AFC 0,58 p < 0.001
βcoefficient
AMH 0.372 p 0.010 AFC 0.414 p 0.004
AMH 0.259 p<0.01 AFC 0.696 p< 0.01 Both strong
Poor response
OR AMH 0.19 p<0.001 OR AFC 0.85 p<0.0001
AMH R2 0.41/0.46 AMH selected in final model
AFC NS
Model AMH, AFC, FSH AMH p<0.001
AFC p0.125
AMH 0.56/0.55, AFC 0.28/0.33
AMH best predictor, AFC NS
AFC 0.11 p0.886 AMH 0.27 p<0.001
Conclusion
AFC
AFC
Based on p value
AFC
Spearman coeff stronger
AMH/AFC
AMH
AMH
AMH
AMH
Conclusion – studies comparing AFC and AMH
AFC
AMH
68
Page 64 of 258
